Data, AI & Analytics · BI Reporting

BI
Dashboards
& Reporting

KPI Dashboards · MIS Reports · Business Insights

Create interactive dashboards and reports that help leadership, teams, and departments track performance, trends, and business outcomes.

Live KPIsReportsInsights
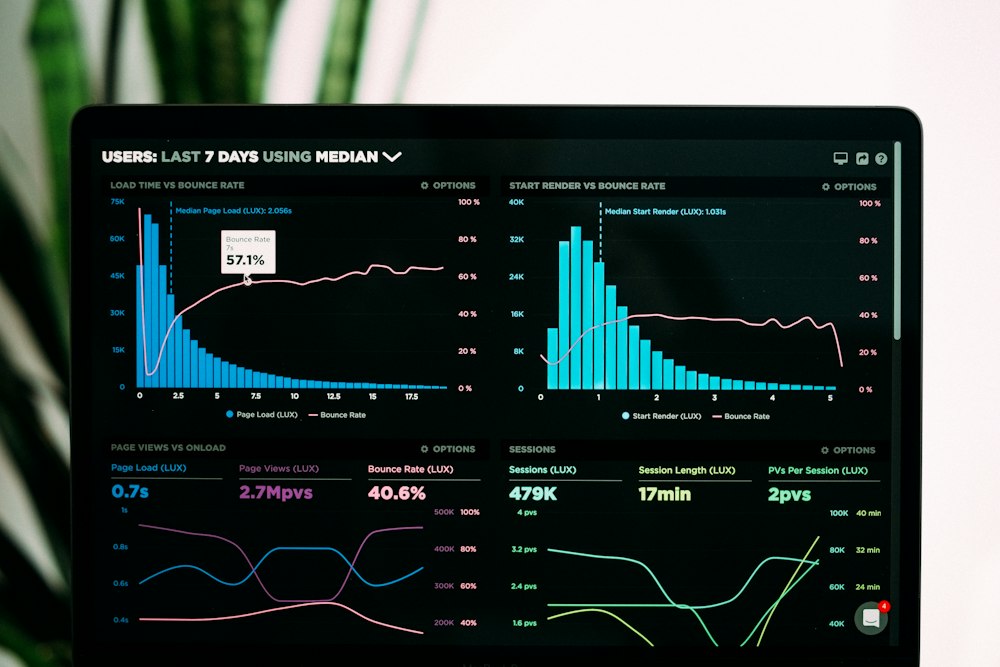
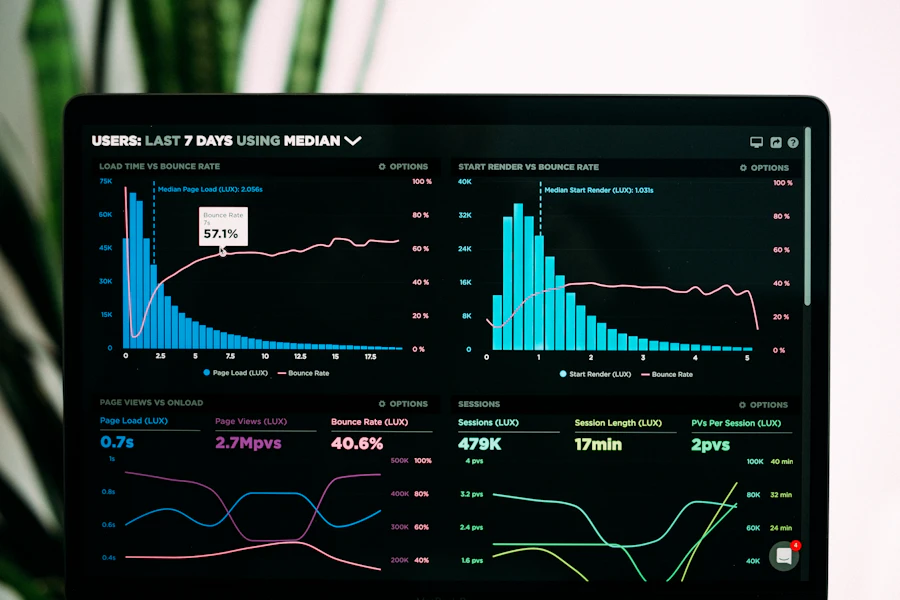
BI dashboards and reporting
KPI DashboardsTrack sales, finance, operations, and team metrics
Visual ReportsConvert complex data into easy visual insights
Decision SupportHelp teams act faster with clear business data
60+ Countries Supported
99.9% Uptime Focus
500+ Projects & Deployments
24/7 Managed Support

What We Deliver

BI Dashboards & Reporting for Better Business Decisions

We create dashboards and reports that turn business data into clear, visual, and actionable insights.

KPI Dashboards

Track Important Business Metrics

We design dashboards for leadership teams to monitor growth, sales, operations, and performance indicators.

  • Executive dashboards
  • Real-time KPI views
  • Performance tracking
  • Visual summaries
Explore KPI Dashboards
KPI dashboard
Sales Reports

Understand Sales and Revenue Performance

We build reports for leads, conversions, revenue, regions, products, teams, and campaign performance.

  • Sales pipeline reports
  • Conversion tracking
  • Revenue trends
  • Team performance
Explore Sales Reporting
Sales reporting
Finance Reports

Track Financial Health Clearly

We create financial dashboards for revenue, expenses, cash flow, collections, profit trends, and cost visibility.

  • Revenue reports
  • Expense tracking
  • Collection reports
  • Profit insights
Explore Finance Reports
Finance dashboard
Operations Reports

Improve Visibility Across Daily Operations

We build reports for productivity, service delivery, inventory, workflow status, and operational bottlenecks.

  • Operational KPIs
  • Workflow reports
  • Inventory views
  • Performance gaps
Explore Operations Reporting
Operations dashboard
Exports

Share Reports Easily Across Teams

We support downloadable reports, scheduled emails, PDF exports, Excel sheets, and role-based reporting access.

  • Excel exports
  • PDF reports
  • Scheduled reports
  • Role-based access
Explore Report Exports
Report exports

Why Choose Quantira

The Quantira Advantage in BI Dashboards & Reporting

We turn raw business data into clear dashboards, KPI views, and decision-ready reports.

01

Executive KPI Visibility

We create dashboards that help leadership track revenue, operations, sales, finance, and performance trends.

KPI DashboardsLeadership ViewPerformance
BI dashboard
02

Department-Level Reporting

We build reports for sales, finance, marketing, operations, HR, inventory, and service teams.

Sales ReportsFinance ReportsOperations
Reporting dashboard
03

Interactive Visual Insights

We design easy-to-use charts, filters, drilldowns, summaries, and visual reports for faster understanding.

Visual ReportsFiltersDrilldowns
Visual reporting
04

Automated Report Delivery

We support scheduled reports, Excel exports, PDF downloads, email summaries, and role-based access.

Excel ExportPDF ReportsAutomation
Automated reports

Our Delivery Process

How We Deliver BI Dashboards & Reporting

We convert business data into dashboards, KPI views, MIS reports, and decision-ready insights.

01

Reporting Requirement Study

We understand KPIs, departments, data sources, report users, and business decision needs.

Step 1
02

Dashboard Planning

We define charts, filters, drilldowns, report formats, data refresh rules, and access levels.

Step 2
03

Dashboard Development

We build visual dashboards, KPI cards, MIS reports, department reports, and export options.

Step 3
04

Validation and Training

We verify numbers, test filters, validate reports, and train users to read dashboards correctly.

Step 4
05

Reporting Support

We support new KPIs, dashboard improvements, scheduled reports, and ongoing reporting updates.

Ongoing

Technology Stack

Technologies We Use For BI Dashboards & Reporting

We use BI, visualization, reporting, database, and automation tools to create decision-ready dashboards.

Power BITableauLooker StudioExcel BICustom Dashboards
SQLPostgreSQLMySQLAPIsData Warehouse
KPI CardsChartsFiltersDrilldownsTrend Views
MIS ReportsSales ReportsFinance ReportsOperations ReportsPDF Reports
Scheduled ReportsEmail ReportsData RefreshAlertsExports
Role AccessUser PermissionsSecure SharingAdmin ControlAudit Logs

Delivery Approach

BI Dashboard Delivery That Turns Data Into Decisions

We create KPI dashboards, MIS reports, and visual analytics for leadership and department-level decisions.

Planning
KPI & Report Mapping

Focus Area

We understand your reporting goals, KPIs, data sources, user roles, department needs, and decision workflows.

Key Outcomes

KPI mapping
Report scope
Data source plan
User access
Development
Dashboard & Report Build

Focus Area

We build KPI cards, charts, filters, drilldowns, MIS reports, exports, and department dashboards.

Key Outcomes

KPI dashboards
Visual reports
Filters
Exports
Support
Validation & Report Updates

Focus Area

We validate data accuracy, refine dashboard views, add new KPIs, and support scheduled reporting.

Key Outcomes

Data validation
New KPIs
Scheduled reports
BI support

BI Reporting Support

Have questions before building BI dashboards?

We help businesses convert raw data into KPI dashboards, MIS reports, and visual insights for better decisions.

KPI dashboards and reports Power BI and custom dashboards Sales, finance, and operations reports Scheduled reports and exports
Discuss BI Dashboards

Frequently Asked

BI Dashboards & Reporting FAQs

We build executive dashboards, sales reports, finance dashboards, operations reports, and department-level KPI views.

We work with Power BI, Tableau, Looker Studio, Excel dashboards, and custom web-based dashboards.

Yes. Depending on the data source, dashboards can support live, scheduled, or periodic refresh.

Yes. We can support Excel exports, PDF reports, scheduled email reports, and role-based report access.

Yes. We add filters, drilldowns, date ranges, category selection, and user-specific views.

Yes. We verify data calculations, filters, totals, and KPI logic before final delivery.

BI Dashboards & Reporting · Get Started

Ready to Build Your BI Dashboard?

  • Build KPI dashboards for leadership, sales, finance, and operations teams
  • Convert raw business data into visual charts, reports, and insights
  • Add filters, drilldowns, scheduled reports, PDF exports, and Excel downloads
  • Improve decision-making with accurate, clear, and role-based reporting

Share your dashboard requirement and our BI team will contact you within 1 business day.

Talk to Our SAP Team